1. Introduction
Established in 2016, Cyclistic is a bike-share offering service located in Chicago, USA. Cyclistic currently offers more than 5,800 bicycles that are geo-tracked and locked into a network of over 690 stations across Chicago. The bikes can be unlocked from one station and returned to another station in the system anytime.
As of August 2021, Cyclistic offers the following pricing plans (USD):
- Single ride passes, $3.30/trip
- Full day passes, $15/day
- Annual memberships, $9/month
The Cyclistic team have recently concluded that annual memberships are more profitable than casual riders. Furthermore, the team have noted that while 30% of users use the bikes for their work commute, the majority of Cyclistic users ride for leisure. This report will assess how existing Cyclistic causal riders can be encouraged to convert to annual memberships.
2. Process
Cyclistic have provided historical trip data to be analysed. For the purpose of this analysis, only data between August 2020 and July 2021 will be assessed. The data has already been processed to remove trips that were below 60 seconds in length (potentially false starts or users trying to re-dock a bike to ensure it was secure). The license to use this dataset can be located here.
There are around 100,000 - 500,000 entries for each month saved under their own MS Excel CSV. Due to the large file sizes, R has been used to clean and process the large datasets. There is minimal human error and data bias since the primary, structured, historical data is taken from the bikes themselves. However, due to data privacy rules, there is no data relating to the type of user.
The data has been cleaned by way of merging all 12 datasets into one, deleting incomplete data elements, removing test station results, removing negative ride lengths and summarising the dataset by date and time variables. The full data cleaning process has been documented in “Data Cleaning Process”.
The data cleaning process highlighted that the “classic” bike type was added to Cyclistic’s portfolio from December 2020 onwards and that there are a few stations which have been added and/or removed from Cyclistic’s portfolio during the analysis time frame.
The cleaned dataset has been saved under the file name “all_trips_cleaned”.
3. Analysis
3.1 Most popular stations
The interactive map demonstrates that the shoreline bike stations centered around the Navy Pier are the most popular, with Streeter Dr & Grand Ave being Cyclistic’s most popular station with 64,998 trips. This confirms Cyclistic’s internal analysis that the majority of its users ride for leisure.
Interacting with the map highlights that the southern stations are Cyclistic’s least popular stations despite the stations covering a large surface area. This indicates that only a small proportion of Cyclistic users use the bikes to commute to and from more residential areas, and instead the vast majority of users use the bikes around the central, tourist locations of Chicago.
3.2 Most popular time of year
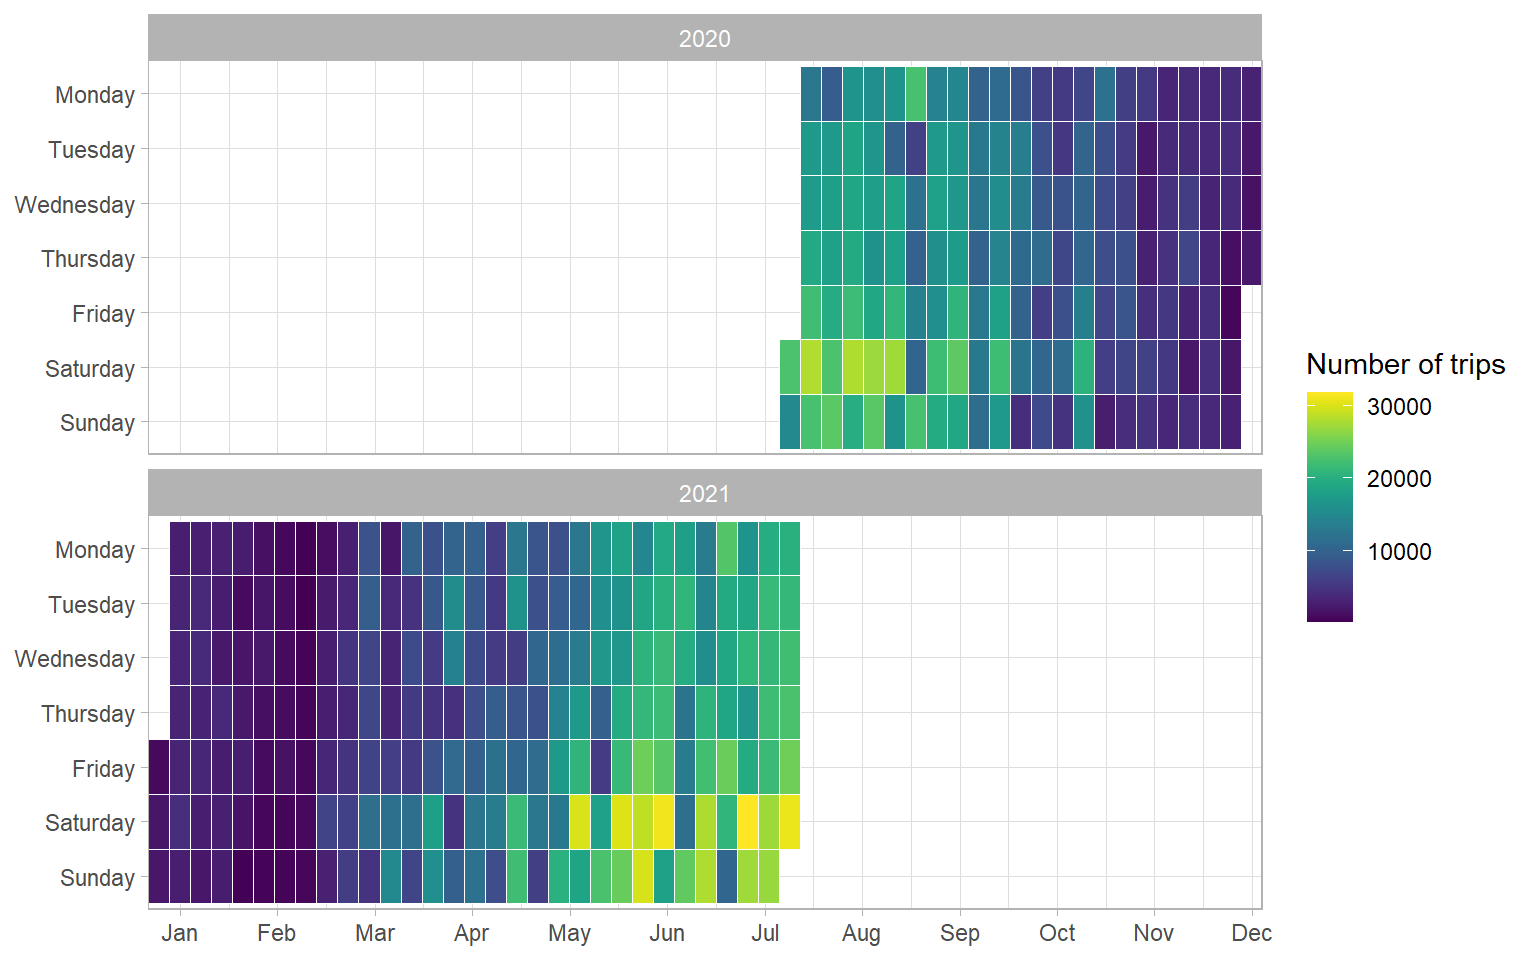
The above heat map shows that the summer months are the most popular time of year for Cyclistic. In addition, the heat map demonstrates that the weekends are the most popular time of week. Similar to section 3.1, this highlights that the majority of users are riding for leisure purposes.
Statistical exploration of this dataset showed that Saturday 17th July 2021 was Cyclistic’s most popular date during the analysis period with 31,877 trips occurring in one day. The increase in trips during the summer of 2021 in comparison to the summer months of 2020 reflects a change in public confidence following the COVID-19 pandemic.
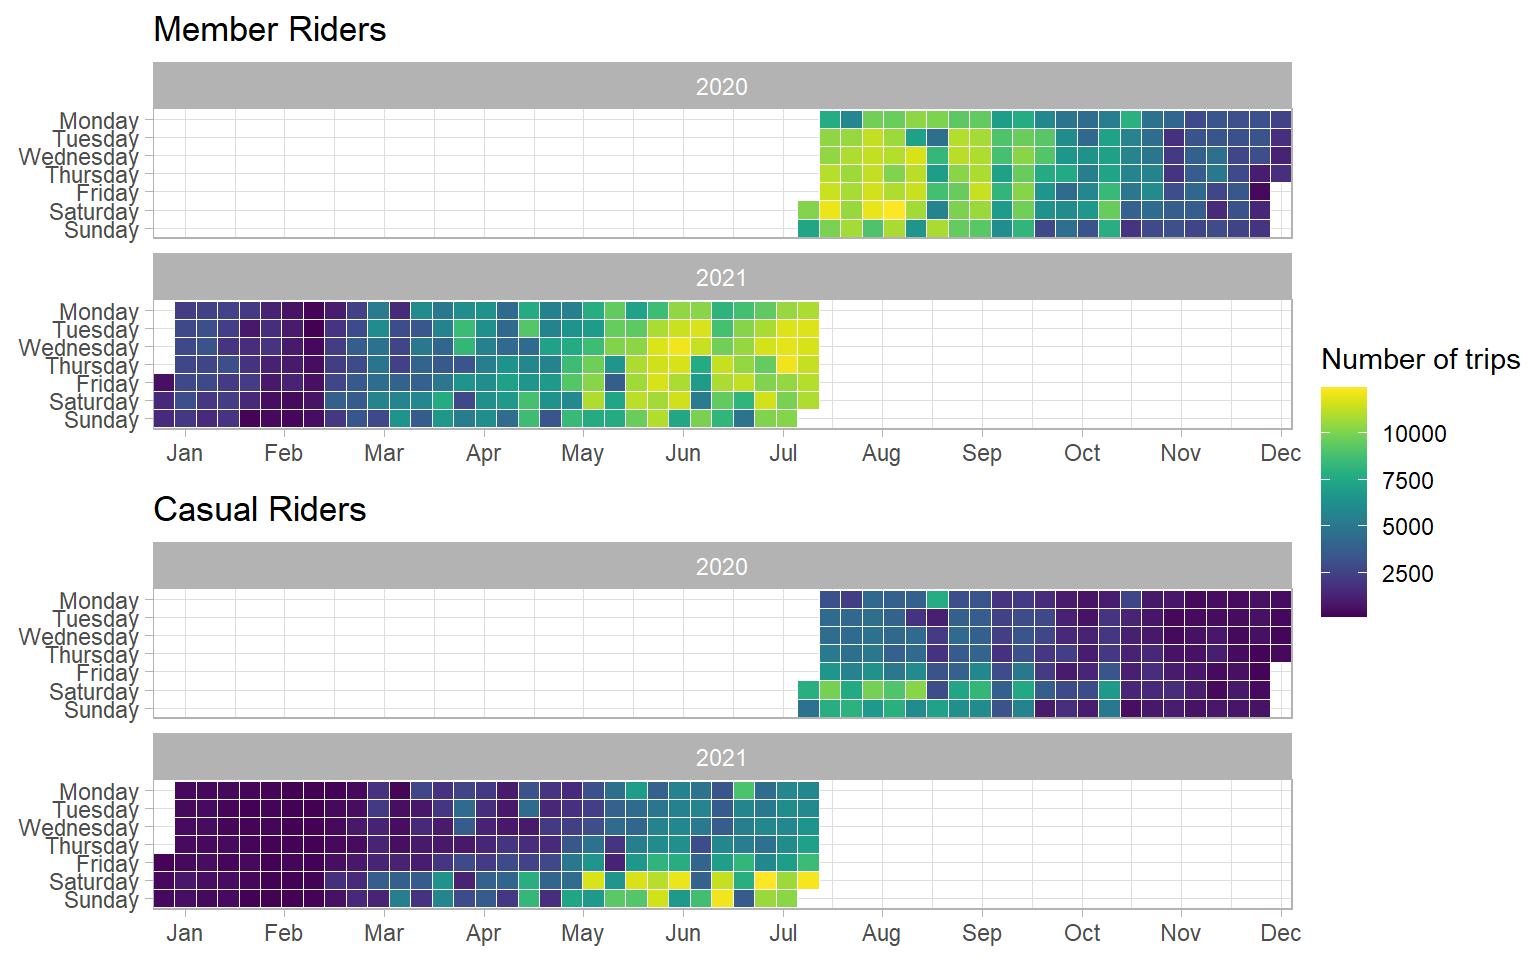
Separating the heat map by casual and member riders shows that members use the Cyclistic service more consistently throughout the year, whereas casual riders tend to only use the bike service during the summer months on the weekend.
Saturday the 29th August 2020 was the most popular day for member riders with 12,448 rides occurring. Following a long period of inactivity due to the state of Illinois issuing a stay at home order in March 2020, it could be argued that member riders peaked during August 2020 as a result of not using their paid memberships during the stay at home order. This insight is in stark contrast to casual riders whose most popular day was Saturday 17th July 2021 with 20,269 trips. This may be as a result of casual riders feeling more comfortable visiting tourist destinations in 2021 rather than 2020.
Interestingly, the most common weekday for members was Wednesday whilst the most common day for casual riders was Saturday. This may indicate that members are using the Cyclistic service for their work commute and other daily activities unlike casual riders whom are using the Cyclistic service for predominately leisure purposes.
3.3 Most popular time of day
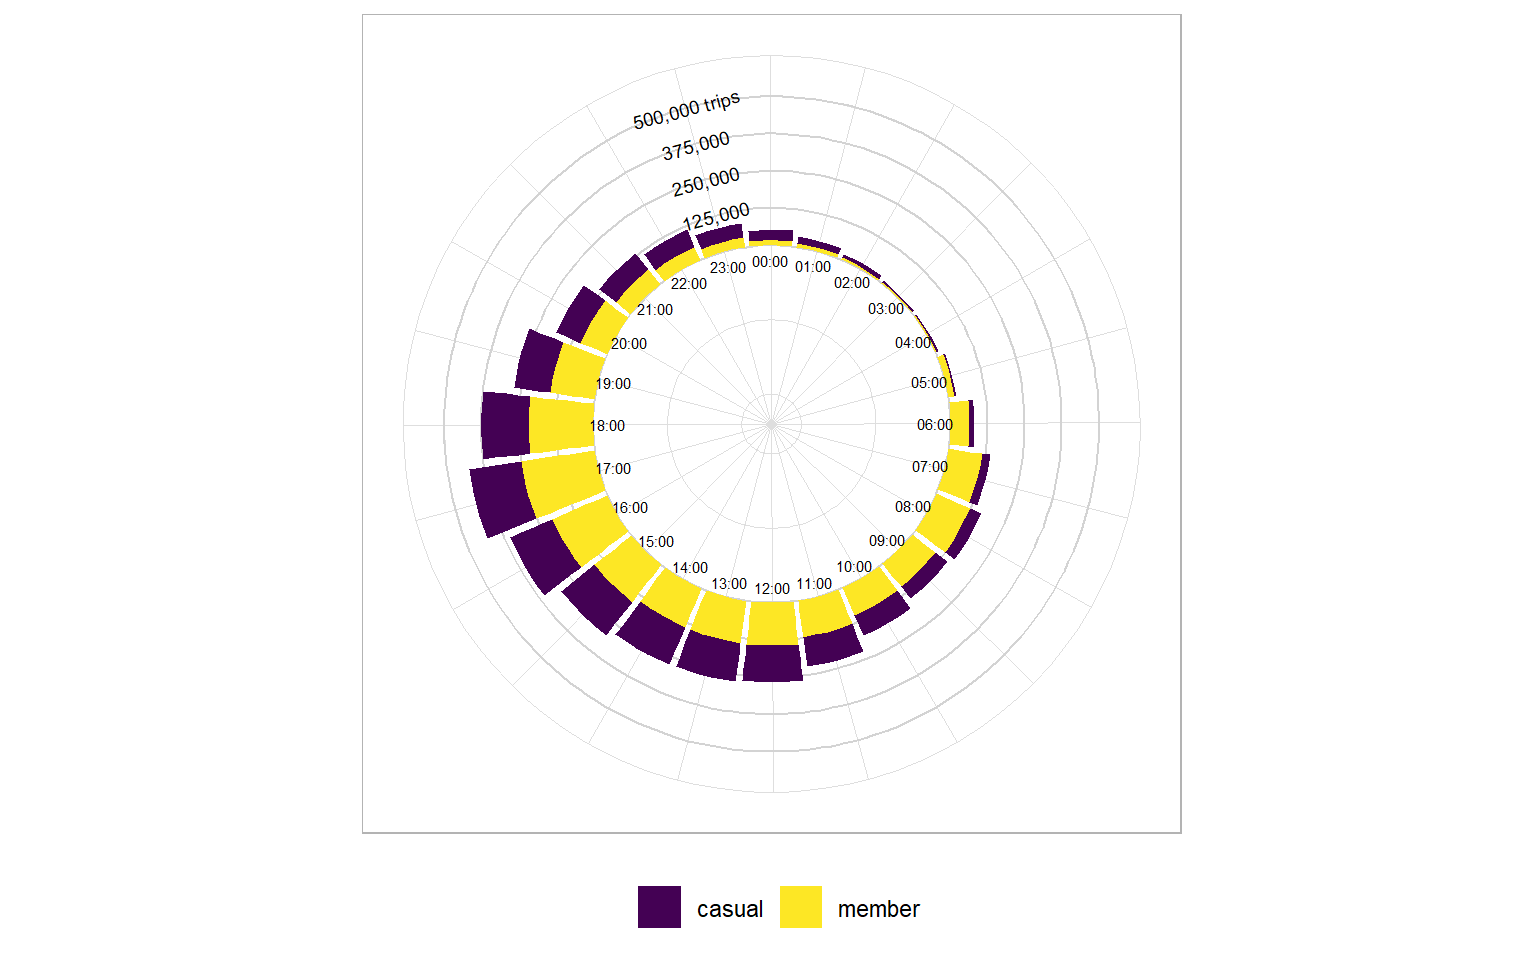
The circular bar plot shows that 5pm is the most popular time of day for Cyclistic users, with the most common time of day being 17:19:15 for casual riders and 17:20:37 for members. The significant increase of member riders using the bikes at 8am and later on around 5pm suggests that a lot of member riders are using the Cyclistic service for their work commutes.
Interestingly, casual riders use the service more than members between 9pm and 5am. This could suggest that casual riders may be using the bike share service instead of taking taxi’s home after a night out. This is further reflected in the average time of day for casual riders which is 15:11:59, as opposed to members whose average time of day is 14:32:12.
The average ride length for casual riders is 37.62 minutes, while members ride for an average of 14.39 minutes. Again this further strengthens the argument that casual riders use Cyclistic bikes for leisure purposes.
3.4 Weather impact
Using data collected by the National Climatic Data Center (NCDC), the impact of weather on the number of trips taken by Cyclistic users can be assessed. For the purposes of this assessment, weather data between August 2020 and July 2021 recorded for the 60614 Chicago, IL zip code (the zip code closest to Cyclistic’s most popular stations) has been used. The license to use this public dataset can be located here.
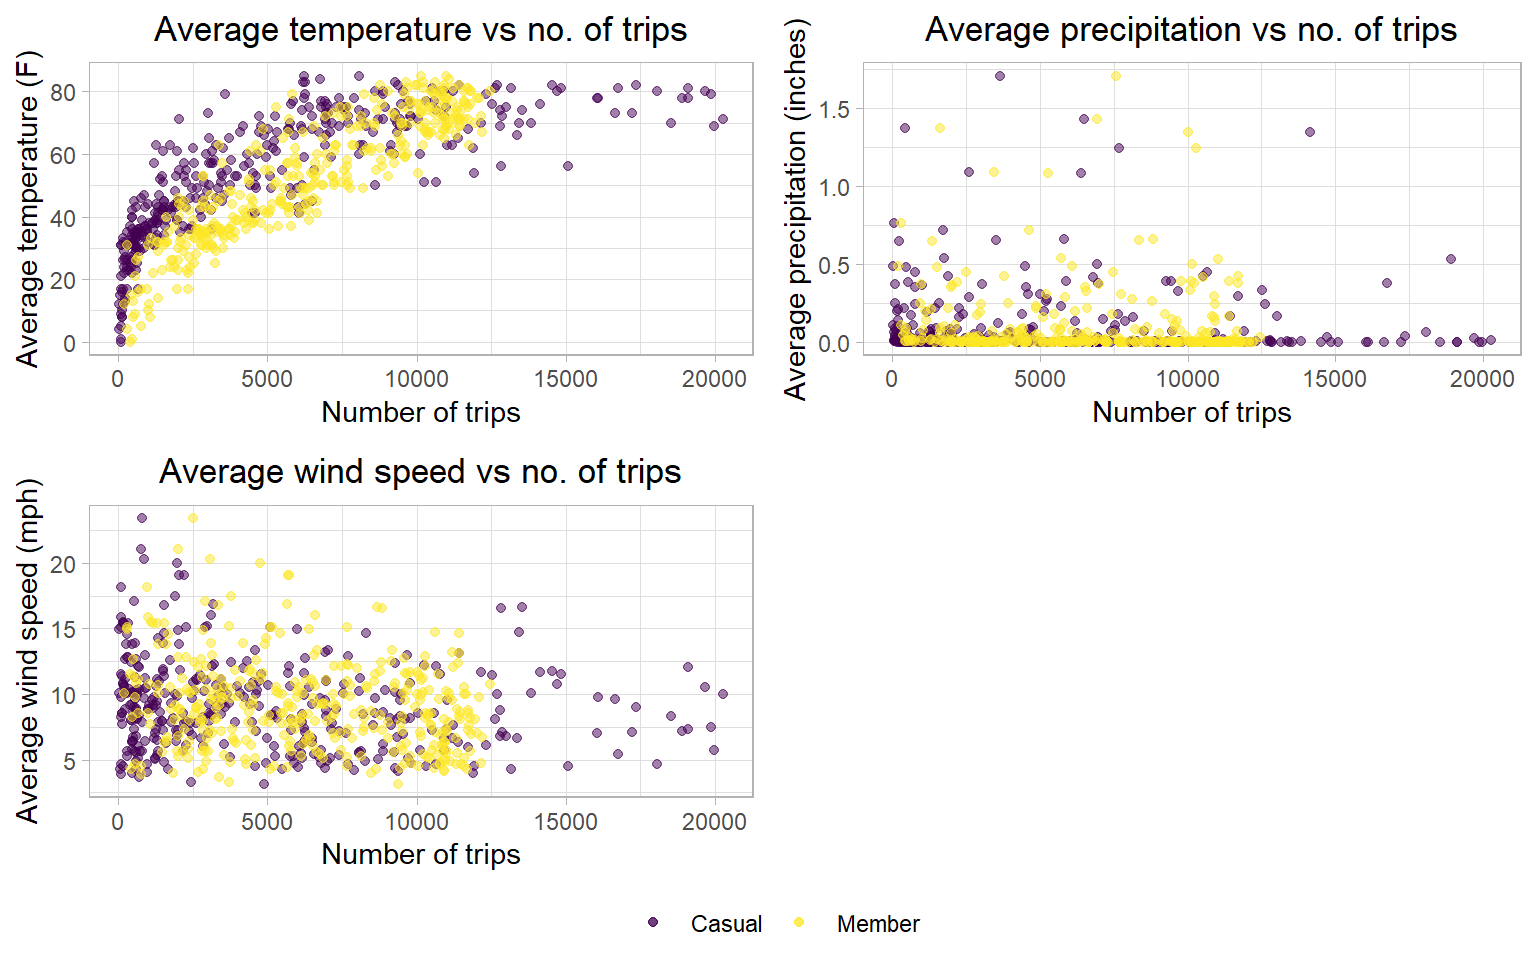
There is a strong positive relationship between average daily temperature and the number of trips taken per day: the higher the temperature the more likely Cyclistic’s bike share service is used. This again reflects the analysis conducted earlier whereby the summer months are the most popular time of year for Cyclistic users.
Colloquially referred to as the “windy city”, wind speed was less of a deterrent to Cyclistic users in comparison to precipitation, whereby the very smallest chance of rain deterred both casual and member riders. The exponential increase in casual riders due to a higher average daily temperature in comparison to a more linear trend for members suggests that members are using the bikes more consistently rather than casual riders.
With an average temperature of 71F, an average precipitation level of 0.1 inches and an average wind speed of 9.993mph, Saturday 17th July 2021 was Cyclistic’s most popular day with 31,887 trips occurring. In contrast, Tuesday 16th February 2021 was Cyclistic’s least popular day with 221 trips occurring on a day with an average temperature of 12F, an average precipitation level of 0.45 inches and an average wind speed of 10.07mph.
4. Recommendations
As identified in the client brief, the marketing recommendations concluded from the insights of this case study should not be focused on encouraging new customers to use the Cyclistic bike service but instead focus on encouraging casual riders to convert to annual memberships.
The three possible marketing recommendations for Cyclistic are as follows:
1. Digital campaign which shows Cyclistic bike’s being used in a Chicago local’s everyday life
Section 3.3 identified that the most common time of day for casual and member riders was 5pm. Although casual riders use the bikes slightly more than members during the evening and early hours of the morning, the most popular time of day for casual riders is similar to member riders which is still during the day with a slight peak during work commute times. This insight highlights that there are casual riders using the Cyclistic service for their work commute without investing in an annual membership. To encourage casual riders to become members, a digital campaign which encourages Chicago locals to observe how Cyclistic fits into their every day life would be beneficial. This would also help change public opinion that Cyclistic is a predominantly tourist service. In addition, it will help spread consumer demand across the city rather than focusing bike usage around the Navy Pier of Chicago.
2. Notifications/ email reminders for casual riders to observe the price benefit of annual memberships
Similar to the insight noted in recommendation 1, for Chicago locals to choose to invest in an annual membership rather than regularly purchasing casual trips with Cyclistic, phone notifications and email reminders should be used to remind regular casual riders (most likely Chicago locals) of the long term pricing benefit from investing in an annual membership rather than purchasing regular casual trips.
3. Digital campaign showing the benefits of using a Cyclistic bike in a post-COVID-19 society
Section 3.2 concluded that there has been an increase in members using the bike service post the COVID-19 Illinois stay at home order. This insight could be capitalized by Cyclistic whereby the benefits of riding bikes outdoors rather than being inside a vehicle with others, or inside a gym with poor airflow, should be highlighted.